Computational Neuroscience-Functional Specialization in the Visual Cortex in the Brain
That’s how I’ve been lured into science, through that childlike wonder and amazement.
— Gül Dölen, Neuroscientist
Perhaps the things we are fascinated by as children never really leave us. They simply change their names. The questions we asked, the things we took apart, the worlds we imagined, and the mysteries we couldn’t stop wondering about may quietly become the threads that lead us into adulthood. For me, that thread eventually led to computational neuroscience. A few weeks ago I had the privilege of attending a summer school on Computational Neuroscience by Trend in Africa hosted at Dedan Kimathi University in Kenya from 28th June to 15th July 2026. It was fascinating to have been in the presence of renowned professors who sat with us through the sessions, and gave us a sneak peek into their world. The lectures were nothing short of exquisite, but the best part for me was definitely the project I signed up for, together with my team of extremely competent students.
The course commenced by a deep dive into the brain, studying its anatomy, functions and being consumed by its complexity which still remains a wonderous mystery. This is what inspired the question that preceded our research project, and no we did not open any brains or do any surgical procedures to answer our question. We worked on data that was already existent, scientists from the Allen Brain Institute, poured into various experiments on the brain using mice, exposing them to different stimuli, recording neural activity and consolidating all that data into one large dataset. Honestly, a single sentence is an understatement of the amount of effort that is evident through that dataset. Our work was to apply the biological knowledge to inspire a research question then using computation turn to the data and draw meaningful insights.
The brain is highly specialized in taking in visual information, within an extremely wide field of view that has different stimuli from objects, to visual navigation to spatial perception, processing it at various levels and thereafter acting on this intelligence. This was the biological background behind our question. Is it possible, that the visual cortex in the brain, has regions that are responsible for encoding different visual stimuli. Can the positioning of these regions infer anything about the information that they encode? How is this information distributed across the various regions and what does that tell us about functional specialization in the visual cortex. Additionally, can we infer anything about the neurons that are responsible for visual perception and their properties? Do biological features, affect these properties? Our question evolved and is still evolves, weeks after the course.
After a comprehensive literature review guided by our teaching assistants from the Allen Brain Institute, we narrowed down from six regions in the visual cortex to three regions of interest that would show us the most differences enough for us to conclusively make significant statistical inferences. This is how we framed the research question:
How do regional differences in VISp, VISal, and VISpm in the visual cortex influence the neural representation and decoding accuracy of drifting grating orientations in RORB-IRES2-CRE Layer 4 neurons?
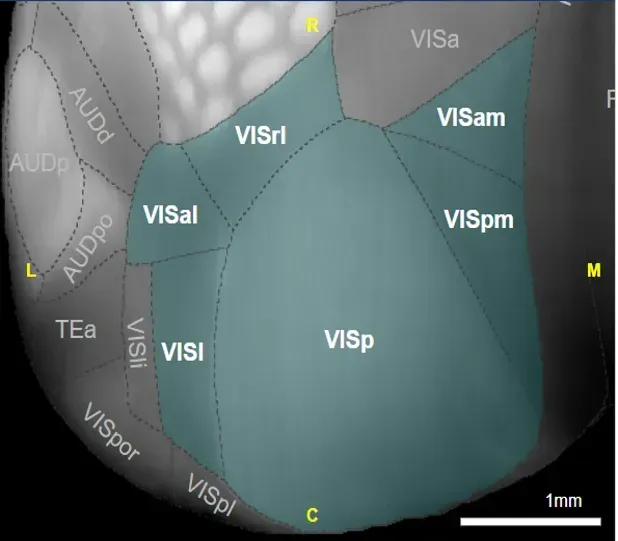
Regions of the Primary Visual Cortex
Calcium imaging, a very robust approach to detecting neural activity in the brain was at the top of our methodology. We identified a cell type, RORB-IRES2-CRE. RORB (RAR-related Orphan Receptor Beta) is a transcription factor that serves as a molecular marker for a specific population of excitatory neurons found predominantly in Layer 4 of the cerebral cortex. The IRES2-CRE genetic system enables researchers to selectively identify and record activity from neurons expressing the RORB gene. Why layer 4, you may ask. It serves as the primary input layer of the visual cortex. Visual information follows the pathway:
Retina -> Lateral Geniculate Nucleus (LGN) -> Layer 4 of the Visual -> Cortex Higher Cortical Layers
Because Layer 4 receives direct sensory input from the thalamus, its neurons provide one of the earliest cortical representations of visual stimuli.
Now that we have a cell type, and have identified our layer of interest, we now move towards the next step in our methodology; the dataset. For us to observe the differences in how intelligence is encoded in the visual cortex, we investigated the regional differences in decoding visual information using the drifting gratings as the stimuli presented to the organism where the feature of interest was orientation. After defining the structure of the dataset, we then moved to data extraction; we needed the calcium imaging traces (representative of neural activity) for each of the three regions. We picked a singular experiment container, and the session where the drifting gratings stimuli was presented to the organism. Neural activity is cleaned, normalized, and organized into feature matrices where neuronal responses represent the input features and drifting grating orientations serve as the target labels.
Then biology meets engineering through machine learning, where decoding was done using a classification algorithm. Logistic regression is a classification algorithm that learns how patterns in input data relate to different categories. Instead of simply predicting a continuous number, it estimates the probability that an observation belongs to a particular class. It does this by learning weights for the input features and passing their weighted combination through a sigmoid function, producing probabilities that can then be converted into class predictions.
In our case, the features were the neural responses of populations of neurons, measured as their mean ΔF/F activity during the presentation of a visual stimulus. Our target was the orientation of the drifting grating, which had eight possible angles. We trained logistic regression to learn the relationship between patterns of neural activity and these eight stimulus orientations. We then tested the trained model on previously unseen data using cross-validation, asking a simple but important question: could the pattern of activity across these neurons tell us which orientation the mouse was viewing?
Our findings where VISp, had the highest decoding accuracy followed by VISal and VISpm.
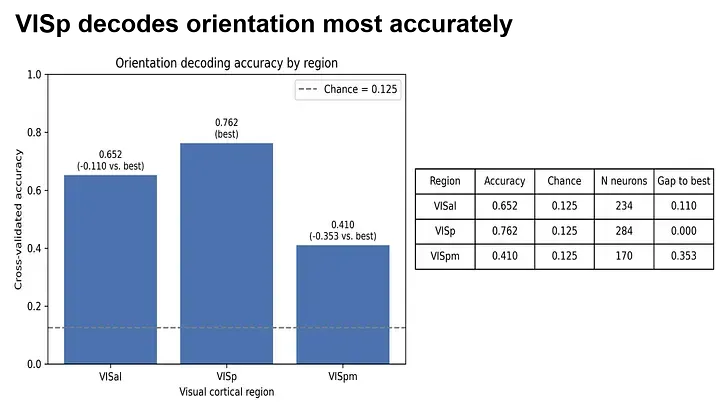
Why did VISp perform best?
The strongest decoding performance in VISp is also consistent with its position as the primary visual cortical area and its relatively direct representation of visual stimulus features. Because our task involved decoding the orientation of drifting gratings, VISp is expected to contain strong and relatively precise representations of basic visual properties such as orientation. The downstream areas VISal and VISpm also contain visual information, but their representations are thought to become increasingly influenced by broader contextual and higher-order aspects of visual processing. Thus, their activity may contain orientation information without being as strongly dominated by the specific stimulus feature we were trying to decode. Our results therefore suggest that functional specialization across visual cortex is not simply a matter of one area having information and another not having it; rather, different regions distribute and transform visual information in different ways. For an orientation-decoding task, VISp appears particularly well suited to preserving the information that our decoder needs.
The decoding accuracy told us which visual region performed best, but the model weights allowed us to look one level deeper: why? In logistic regression, each neuron is assigned a weight that reflects how strongly its activity contributes to distinguishing between stimulus orientations. By examining these weights, we could identify neurons that contributed most strongly to the decoder’s predictions. We then compared these informative neurons with their response properties, asking whether decoding performance was driven simply by having more neurons, or by the quality of the information represented by those neurons.
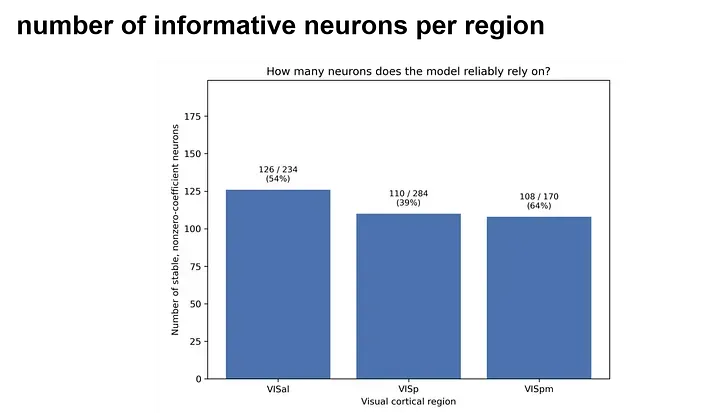
Interestingly, our results suggested that the number of informative neurons alone did not explain decoding performance. The region that achieved the highest decoding accuracy had the fewest informative neurons. This points toward a more nuanced interpretation: what matters may not be how many neurons carry information, but how selectively they respond, how clearly the stimulus is represented, and how the activity of neurons works together as a population. In other words, a smaller population of highly informative and well-coordinated neurons can potentially outperform a larger population whose responses contain less discriminative information.
Decoding accuracy tells us where information is most accessible; model weights help us investigate which neurons contribute to that information; and the relationship between the two helps us think about how information is organized across the brain.
I am still mulling over this project and how much I got to learn in just under 20 days. My key take away, machine learning is the best thing ever and I have been down its rabbit hole since the course ended. Sometimes events happen to awaken a fire in you, and Trend Camina 2026 was my Damascus moment.